Analytics and User Feedback
4 minute read
Adding Analytics
The Docsy theme contains built-in support for Google Analytics via Hugo’s internal template, which is included in the theme. Once you set Analytics up as described below, usage information for your site (such as page views) is sent to your Google Analytics account.
Setup
-
Ensure you have set up a Google Analytics property for your site: this gives you an Analytics ID to add to your config, which Docsy in turn adds to all your site’s pages.
-
Open
config.toml. -
Enable Google Analytics by setting the Tracking ID property to your site’s Analytics ID.
[services.googleAnalytics] id = "UA-00000000-0" -
Save and close
config.toml. -
Ensure that your site is built with
HUGO_ENV="production", as Docsy only adds Analytics tracking to production-ready sites. You can specify this variable as a command line flag to Hugo:$ env HUGO_ENV="production" hugoAlternatively, if you’re using Netlify, you can specify it as a Netlify deployment setting in
netlify.tomlor the Netlify UI, along with the Hugo version.
User Feedback
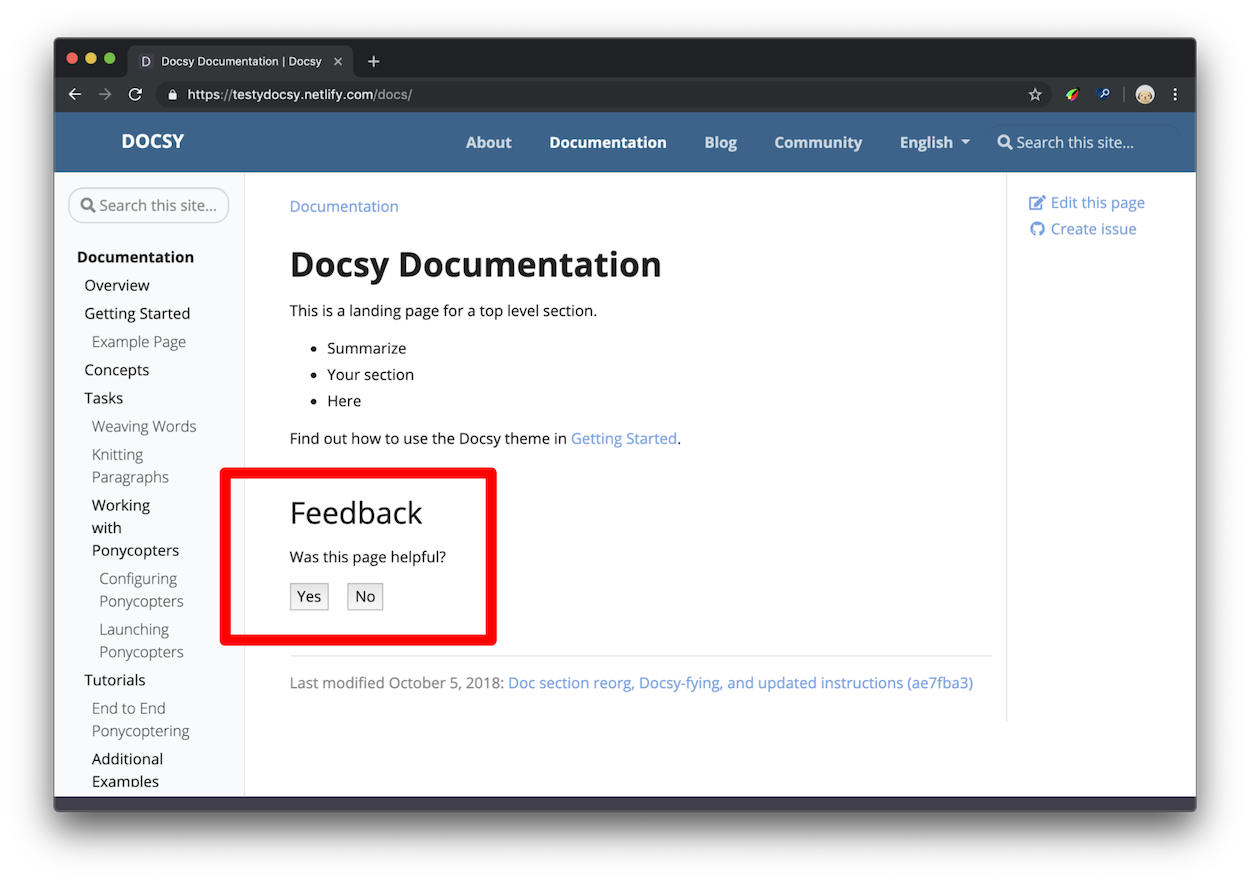
By default Docsy puts a “was this page helpful?” feedback widget at the bottom of every documentation page, as shown in Figure 1.
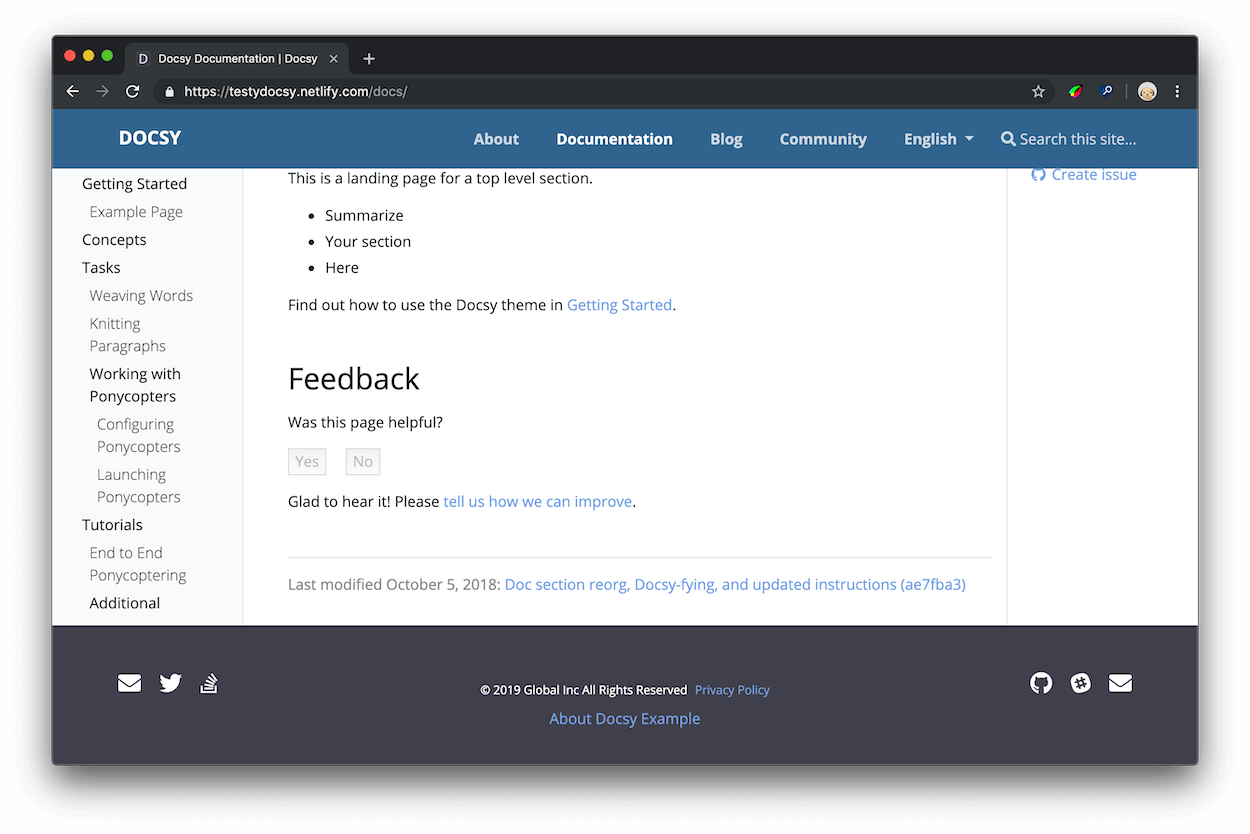
After clicking Yes the user should see a response like Figure 2. You can configure the
response text in config.toml.
How is this data useful?
When you have a lot of documentation, and not enough time to update it all, you can use the “was this page helpful?” feedback data to help you decide which pages to prioritize. In general, start with the pages with a lot of pageviews and low ratings. “Low ratings” in this context means the pages where users are clicking No — the page wasn’t helpful — more often than Yes — the page was helpful. You can also study your highly-rated pages to develop hypotheses around why your users find them helpful.
In general, you can develop more certainty around what patterns your users find helpful or unhelpful if you introduce isolated changes in your documentation whenever possible. For example, suppose that you find a tutorial that no longer matches the product. You update the instructions, check back in a month, and the score has improved. You now have a correlation between up-to-date instructions and higher ratings. Or, suppose you study your highly-rated pages and discover that they all start with code samples. You find 10 other pages with their code samples at the bottom, move the samples to the top, and discover that each page’s score has improved. Since this was the only change you introduced on each page, it’s more reasonable to believe that your users find code samples at the top of pages helpful. The scientific method, applied to technical writing, in other words!
Setup
-
Open
config.toml. -
Ensure that Google Analytics is enabled, as described above.
-
Set the response text that users see after clicking Yes or No.
[params.ui.feedback] enable = true yes = 'Glad to hear it! Please <a href="https://github.com/USERNAME/REPOSITORY/issues/new">tell us how we can improve</a>.' no = 'Sorry to hear that. Please <a href="https://github.com/USERNAME/REPOSITORY/issues/new">tell us how we can improve</a>.' -
Save and close
config.toml.
Access the feedback data
This section assumes basic familiarity with Google Analytics. For example, you should know how to check pageviews over a certain time range and navigate between accounts if you have access to multiple documentation sites.
- Open Google Analytics.
- Open Behavior > Events > Overview.
- In the Event Category table click the Helpful row. Click view full report if you don’t see the Helpful row.
- Click Event Label. You now have a page-by-page breakdown of ratings.
Here’s what the 4 columns represent:
- Total Events is the total number of times that users clicked either Yes or No.
- Unique Events provides a rough indication of how frequently users are rating your pages per session. For example, suppose your Total Events is 5000, and Unique Events is 2500. This means that you have 2500 users who are rating 2 pages per session.
- Event Value isn’t that useful.
- Avg. Value is the aggregated rating for that page. The value is always between 0 and 1. When users click No a value of 0 is sent to Google Analytics. When users click Yes a value of 1 is sent. You can think of it as a percentage. If a page has an Avg. Value of 0.67, it means that 67% of users clicked Yes and 33% clicked No.
The underlying Google Analytics infrastructure that stores the “was this page helpful?” data is
called Events. See docsy pull request #1 to see exactly
what happens when a user clicks Yes or No. It’s just a click event listener that
fires the Google Analytics JavaScript function for logging an Event, disables the Yes and
No buttons, and shows the response text.
Disable feedback on a single page
Add hide_feedback: true to the page’s front matter.
Disable feedback on all pages
Set params.ui.feedback.enable to false in config.toml:
[params.ui.feedback]
enable = false
Feedback
Was this page helpful?
Glad to hear it! Please tell us how we can improve.
Sorry to hear that. Please tell us how we can improve.